


Cryptocurrency trading has become a global phenomenon, attracting novice and experienced investors. Any trader looking to make money in the ever-changing cryptocurrency market must know the primary indications that dictate price changes. Candlestick patterns for cryptocurrencies are one such technique. You may enhance your trading approach using these visual clues to help you anticipate market movements, locate entry and exit positions, and more.
This in-depth tutorial teaches about cryptocurrency candlestick patterns, how to read them, and why they’re a must-have for any trader. No matter where you are in your trading journey, this blog is an excellent resource for learning the ropes and improving your game.
What Are Cryptocurrency Candlestick Patterns?
First, let’s review the fundamentals before getting into the nitty-gritty. A cryptocurrency candlestick is a standard way to display the time value on a price chart to monitor the value of Bitcoin, Ethereum, and other altcoins. The visual depiction of price activity over a specific period provided by these candlesticks facilitates traders’ analysis and decision-making.
The four essential parts of a candlestick are:
- Open price: The starting point for trading the coin within that time interval.
- Close price: The selling price of the cryptocurrency at the end of the trading period.
- High price: The peak price that was achieved throughout the trading session.
- Low price: The lowest price reached during the trading period.
The candlestick’s body displays the price change from opening to closing, while the wick, or shadow, depicts the high and low points of that period.
When one or more candlesticks come together to create a pattern, it signifies a change in market mood. To make educated trading decisions, traders look for these patterns to determine whether the market is about to reverse or continue.
Candlestick patterns in cryptocurrency—why?
Cryptocurrency traders need the correct tools to analyze price swings because the market may be unpredictable. Several reasons make candlestick patterns essential:
Predict Price Movements
Candlestick patterns allow traders to estimate the future direction of the price of a cryptocurrency by using previous data as part of their analysis. If you can recognize specific patterns, you can predict market movements, giving you an advantage when making judgments on trading.
Identify Market Sentiment
Regarding market emotion, each candlestick pattern has its unique tale to tell, whether the market is bullish, bearish, or neutral. When you have a solid grasp of these patterns, you can determine how traders feel about a specific cryptocurrency at any moment.
Improve Decision-Making
Traders can make more informed and accurate judgments when they use candlestick patterns in conjunction with other tools for technical analysis. Precise signals for possible entry or exits may be obtained through bullish and bearish engulfing, doji, and hammer chart patterns.
Types of Cryptocurrency Candlestick Patterns
For market analysis, traders use a variety of candlestick patterns. When coupled with other indications of technical analysis, some of these patterns may be quite helpful for traders of cryptocurrencies. Here are a few of the most prominent and often-used Bitcoin candlestick patterns you need to know.
Bullish Engulfing Pattern
A bullish engulfing pattern suggests that prices are about to rise. It happens when a little red candlestick—a bearish indicator—is followed by a giant green candlestick—a bullish indicator—that entirely consumes the body of the preceding candlestick. Prices might go up if this trend continues, as it indicates that buyers are in charge.
Bearish Engulfing Pattern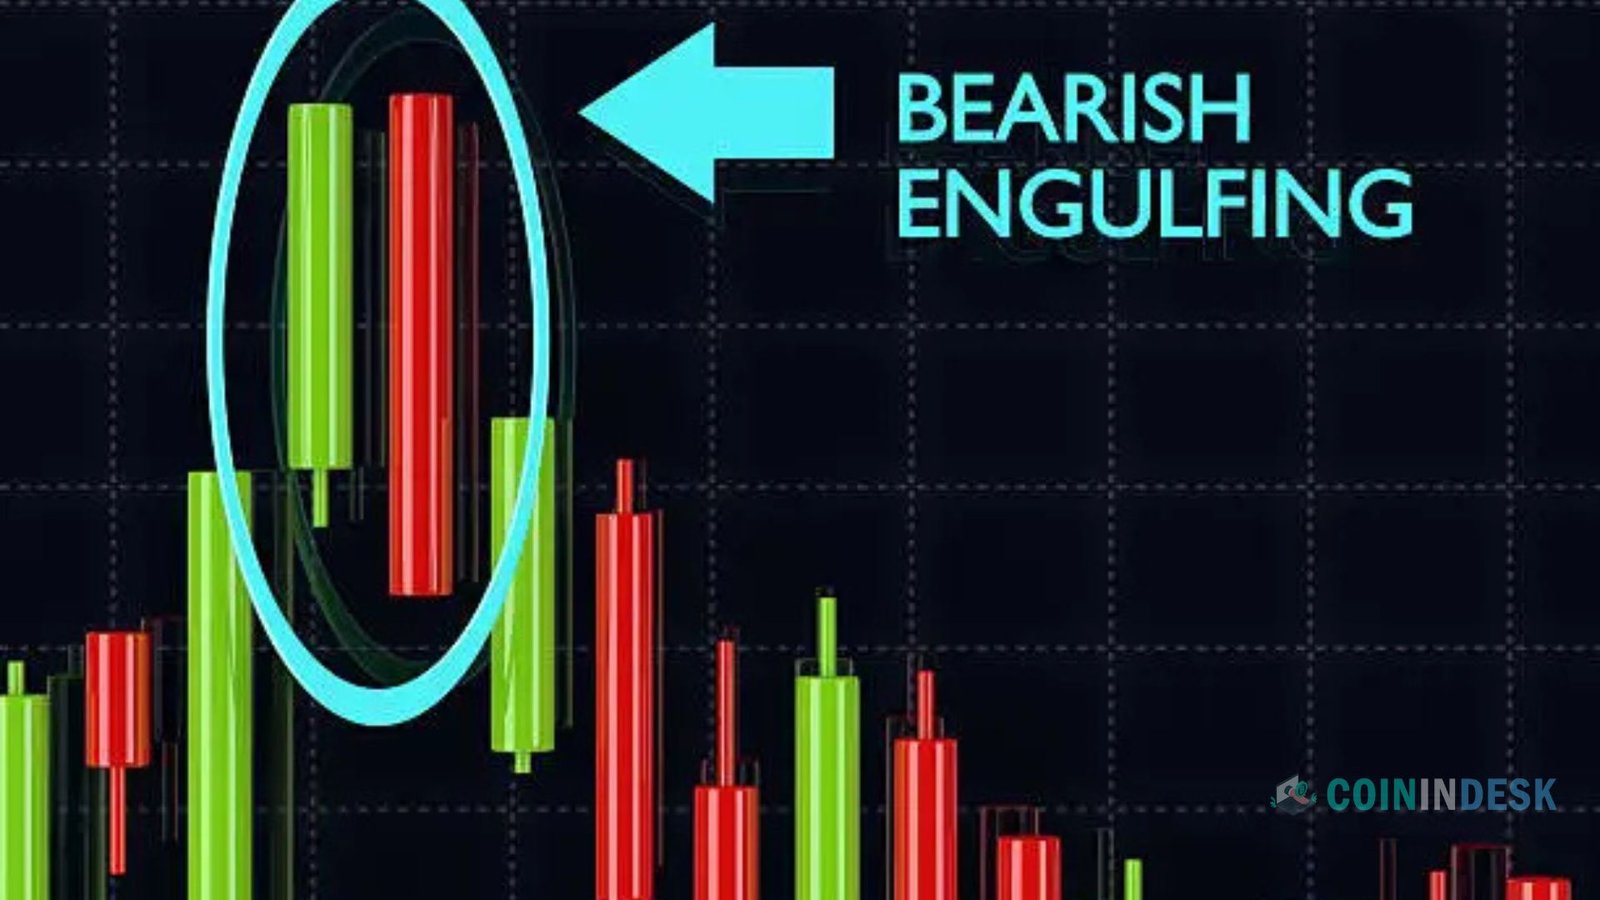
On the other hand, a bearish engulfing pattern may be described as follows: a little green bullish candlestick is followed by a larger bearish red candlestick that engulfs the preceding one. Sellers appear to have taken the lead; this pattern portends a possible price drop.
Doji Candlestick
The neutral doji candlestick pattern indicates market indecision. It takes shape when the closing and starting prices close, resulting in a tiny body with lengthy shadows on top and bottom. Although a single doji candlestick cannot be used to make a definitive statement, its appearance following a strong uptrend or decline may indicate a possible reversal.
Hammer Candlestick
A hammer candlestick is characterized by a lengthy bottom shadow and a tiny body toward the price range’s upper end. This pattern typically emerges near the bottom of a downturn, indicating that the market could be about to turn around and go up. As the hammer shows, buyers intervened and drove the price back up after sellers attempted to drive it down.
Shooting Star
When an uptrend is nearing its peak, the inverse of a hammer, the shooting star, appears. The extended upper shadow and little body toward the bottom of the candlestick show sellers could drive higher prices than purchasers. If this pattern persists, it may indicate that prices are about to turn downwards.
Morning Star and Evening Star
Possible reversals are indicated by the morning star and evening star, which are multi-candle patterns. A big bearish candlestick, a small-bodied candlestick (often called a doji), and a vast bullish candlestick make up a morning star. An upswing is replacing a downturn, according to this pattern.
The evening star indicates a change from an upward to a downward trend, which is the inverse of the morning star. It comprises three candlesticks: one significant bullish, one little bearish, and one small-bodied one.
The Rising and Falling Three Methods
Two examples of continuation patterns are the three rising techniques and the three falling methods. The ascending triangle pattern is an uptrending sequence of three candlesticks: a huge bullish one, three smaller bearish ones, and another huge bullish one. Based on this pattern, it seems like the upswing will keep going.
On the other hand, a downtrend is indicated by the dropping three ways, which suggests that the downturn will continue. This pattern consists of a big bearish candlestick, three smaller bullish candlesticks, and another big bearish candlestick.
Trading using Cryptocurrency Candlestick Patterns
After reviewing the most typical Bitcoin candlestick patterns, we can discuss how to incorporate them into your trading plan. To get the most out of candlestick patterns, use them with other indicators and employ sound risk management strategies.
Combine with Other Technical Indicators
Candlestick patterns are valid and shine when combined with other technical analysis tools such as moving averages, RSI, and MACD. You may improve the accuracy of your forecasts by using these tools to check the indications supplied by candlestick patterns.
Understand Market Context
Before taking action based on a candlestick pattern, it is crucial to understand the more extensive market environment. To illustrate, a bullish engulfing pattern in an uptrending market would not be as dependable as in a downtrending market. Consider the big picture and everything else that might influence the coin’s price.
Use Candlestick Patterns for Timing Entries and Exits
The best way to find the best times to enter and exit a market is to look for candlestick patterns. For instance, a hammer candlestick following a decline would indicate an ideal opportunity to initiate a long trade. Similarly, if the market forms a bearish engulfing pattern following an increase, it may be wise to consider selling or cutting your losses.
Practice Risk Management
The bitcoin market is well-known for its extreme volatility, and no trading technique guarantees a profit. To safeguard your money, it is essential to establish stop-loss orders and determine your risk tolerance. Although candlestick patterns might be helpful for trend spotting, they do not provide a foolproof method, so it is essential to exercise sound risk management.
Conclusion
Expertizing cryptocurrency candlestick patterns can significantly improve your trading technique and market movement prediction abilities. A solid grasp of these patterns and other technical analysis techniques may help you navigate the lightning-fast world of cryptocurrency trading.
Although candlestick patterns aren’t 100% accurate, they help you gauge market emotion and spot essential trends or reversals. Whether you’re just starting or have years of expertise, candlestick analysis is a great skill when dealing with the complexity of the Bitcoin market.
Trading well requires more than pattern recognition, practice, knowledge, and self-control regarding risk. If you keep at it, you’ll eventually be able to seize the best opportunities when they arise!
Read More: How to Sell Gift Cards for Crypto? Card to Digital Currency
[sp_easyaccordion id=”5463″]