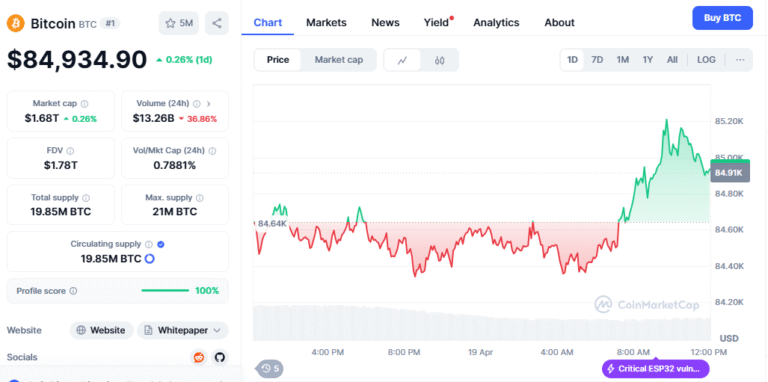
Bitcoin price analysis, On the daily chart, Bitcoin (BTC) continues to trade within a defined range, maintaining a constant level distance between crucial support and resistance zones. Following a declining high close to $88,772, the price found support at $74,434 and rebounded dramatically in a V-shaped recovery. Currently, BTC is trading near $84,549, with sideways consolidation now in effect. As the main upside level, traders are attentively observing $86,000. A clear closing above it would indicate fresh, optimistic momentum. On the downside, a break below $82,000 could lead to a more significant adjustment toward the mid-$70,000 range.
BTC in Tight Range with Bearish Bias
Turning now to the 4-hour chart, Bitcoin‘s price action has formed a corridor between $83,031 and $86,450, with BTC’s price reaching beyond $ 87,500. The mixed candlestick forms and low volatility in this range-bound trend indicate a period of uncertainty. Especially with further volume, a clean breakout above $86,450 would support optimistic belief. On the other hand, a fall below $83,031 could raise selling pressure. Traders should remain agile and adjust their risk management strategies to account for the possibility of strong intraday fluctuations.
BTC has been trading in a declining channel since reaching a brief peak of $85,478 on the one-hour chart. Recent lows of around $83,751 indicate a decline in momentum, and the price now moves within a consolidation range. Short-term scalping techniques might present better setups than forceful directional trades. While a breakdown below $83,750 on increasing volume may drive BTC toward the $83,000 mark or lower, price action between $83,750 and $84,000 could offer long prospects.
BTC Momentum Mixed
Momentum indicators provide a mostly benign picture. At 52, the Relative Strength Index (RSI) indicates a balance between buying and selling forces. While the Commodity Channel Index (CCI) at 76 points to slight bullishness, the Stochastic Oscillator remains at 84 and hangs in overbought territory. With a low average directional index (ADX) of 13, the weak trend is evident; the Awesome Oscillator (AO) at 1.063 indicates a state of equilibrium. However, momentum (MOM) at 8.334 and a MACD level of –95 points to a bullish divergence, suggesting underlying strength just waiting to be uncovered.

Moving averages help to define the short-term positive inclination further. With the 10-, 20-, and 30-period EMAs all concentrated near current price levels, exponential moving averages (EMAs) are aligned in favor of buyers on shorter timesframes. Likewise, over the exact time frames, simple moving averages (SMAs) support upward continuation. Longer-term EMAs and SMAs, on the other hand, remain in negative territory; the 50- and 100-period EMAs, as well as the 100- and 200-period SMAs, respectively, place themselves considerably above the current price action, thereby providing possible resistance levels should BTC attempt a breakout.
Next Move for Bitcoin?
Bitcoin price analysis: From a positive standpoint, a daily close above $86,000, combined with increasing volume, might set the stage for the $90,000 zone. Maintaining the aforementioned important short-term EMAs will further emphasize this scenario. From a bearish standpoint, a breakdown below $82,000, combined with a 1-hour channel breach under $83,750 on high volume, would raise the possibility of a more significant drop toward the mid-$70,000s.
All set to keep one step ahead of the market? Subscribe now for critical technical updates, real-time insights, and practical trade setups. Remain current and trade with assurance.


